Quiz Entry - updated: 2026.07.30
What is the purpose of Threat Modeling diagrams and what do they visualize?
They overlay trust boundaries onto a data-flow diagram (processes, flows, stores, external entities) so you can apply STRIDE wherever data crosses from one trust level to another.
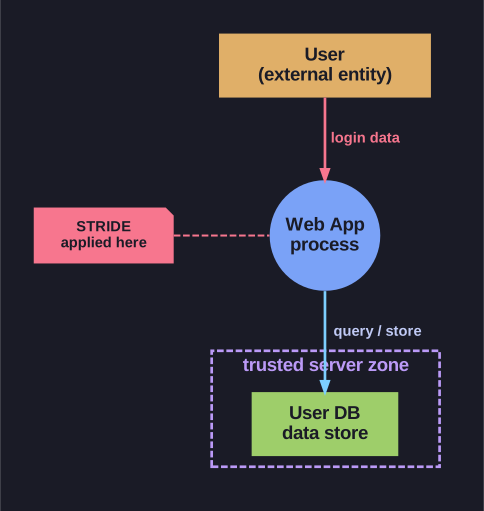
* Threat-model DFD — STRIDE is applied where a data flow crosses the dashed trust boundary into the trusted server zone. *
Threat Model Components:
- Processes - Components that process data
- Data Flows - Movement of data between components
- Data Stores - Where data is stored
- Trust Boundaries - Lines separating different trust levels (shown as dashed red lines)
- External Entities - Users, attackers, external systems
Trust Boundary Analysis:
- Data crossing trust boundaries requires special attention
- Different colored zones indicate different trust/risk levels:
- Yellow/Orange: Lower trust zones
- Pink/Red: Higher risk zones
- Green: Trusted/secure zones
STRIDE Application:
- Apply STRIDE to each element crossing trust boundaries
- Identify threats at each data flow
- Document threats with red markers/indicators
Key Insight: Threat modeling combines DFDs with trust boundaries to systematically identify where security controls are needed.
Go deeper:
 OWASP Threat Modeling Cheat Sheet — DFDs, trust boundaries, and applying STRIDE where data crosses boundaries.