Quiz Entry - updated: 2026.07.30
What is the role of the PERT distribution and Monte-Carlo simulation in computing a "good" cyber risk number?
PERT turns expert estimates (min, most-likely, max) into a smooth probability distribution. Monte-Carlo then samples thousands of combinations to produce a full risk distribution, not a single point estimate.
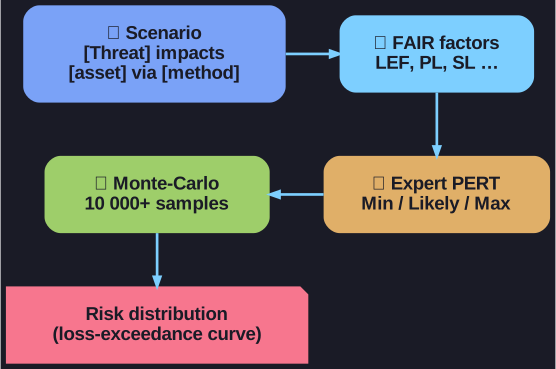
* From a scenario to a defensible loss distribution: FAIR factors → PERT estimates → Monte-Carlo sampling. *
The pipeline (4 steps in the FAIR flow):
- Scenarios — define the risks ("[Threat] impacts [asset] via [method], causing [effect]").
- FAIR factors — break down into LEF, PL, SL, etc.
- Expert estimation → PERT — for each factor, experts give Min / Most-Likely / Max. PERT (a beta-like distribution) shapes this into a probability curve.
- Monte-Carlo simulation — draw 10 000+ random samples, multiply LEF × LM each time, and observe the resulting distribution.
Why it's better than a point estimate:
- A single "CHF 200k expected loss" hides the worst case — what's the 90th percentile? 99th?
- Output charts include an Exceedance Probability Curve (probability of loss ≥ X) and Loss Exceedance Curve — these are what risk-appetite decisions are actually made on.
- It turns "expert gut feel" into a defensible, transparent number.
Tip: The open-source pyfair library (pip install pyfair) implements this end-to-end — useful if you want to play with the simulation yourself.
Go deeper:
 PERT distribution (Wikipedia) — the min / most-likely / max three-point distribution that encodes expert estimates.
- Monte Carlo method (Wikipedia) — repeated random sampling that turns those distributions into a loss-exceedance result.